After leveraging online reviews in your B2B Marketing and Sales, comes what’s arguably the hardest part: how do you measure the ROI reviews?
This post is a how-to guide on measuring the value of online reviews for vendors in B2B SaaS.
How to measure the impact and ROI of B2B software reviews?
Measuring the ROI of reviews can be a challenge because reviews offer vendors value in many ways.
TrustRadius found that the average tech vendor uses B2B review sites for 7 different use cases. The value reviews provide from Demand Gen to Customer Marketing to Product Marketing to Sales through Customer Success.
So before diving in to measure the ROI on specific uses like lead generation from a B2B software review site, it can help to understand the value of reviews more holistically.
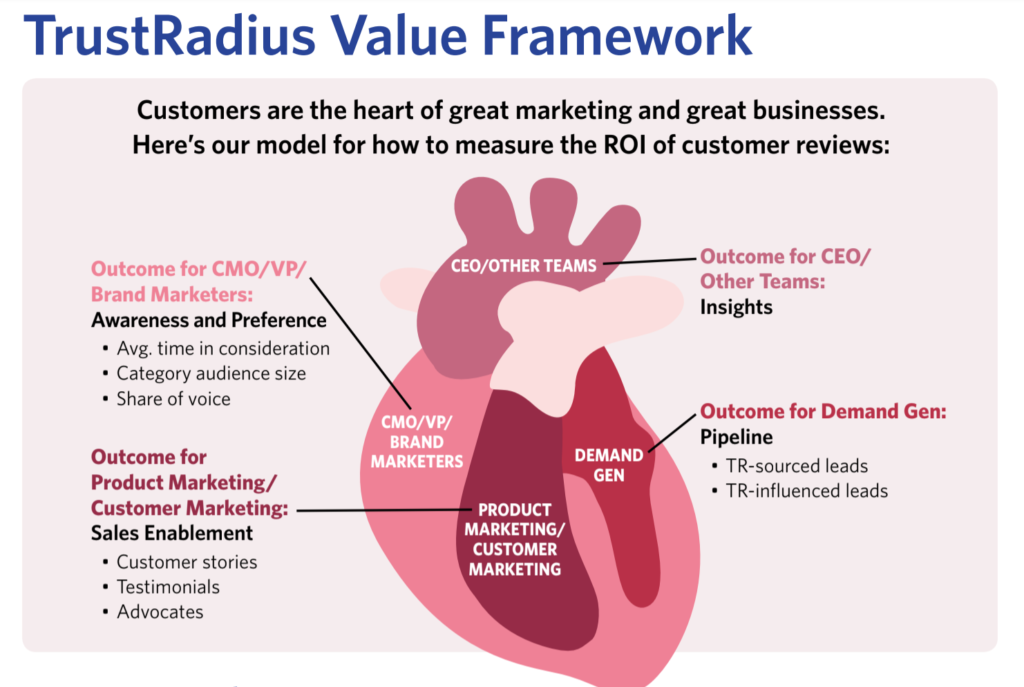
TrustRadius helps us understand the holistic impact of reviews with their heart analogy, known as their “TrustRadius Value Framework” in the guide to The ROI of Reviews. Reviews connect different parts of Marketing and the organization more broadly. While many vendors tend to focus on some parts, like Demand Gen, the stronger the other parts like Product and Customer Marketing work, the more healthy the demand gen part becomes.
If you’re looking to measure any of the ten bullet points in the TrustRadius Value Framework diagram, you can get formulas to measure each in the ROI of Reviews guide.
How online reviews are measured in B2C and eCommerce
B2B Marketers often look to B2C for inspiration. Reviews are no different.
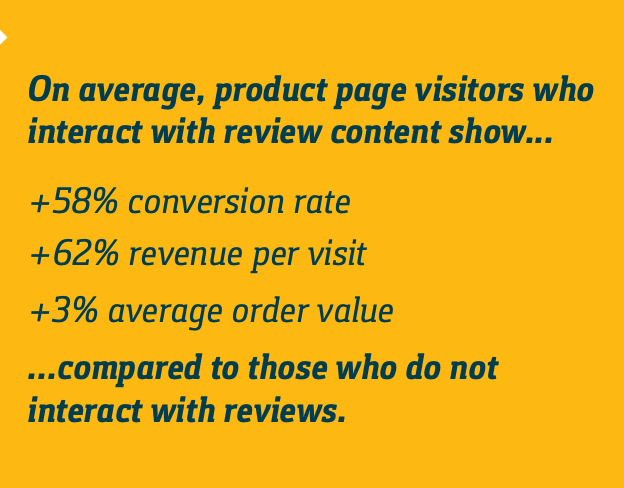
eCommerce vendor BigCommerce wrote about the value of customer testimonials and shared some stats. One stat of note is from Bazaarvoice’s report, The Conversation Index: Volume 8, in which they found that:
“On average, product page visitors who interact with review content show…+58% conversion rate, +62% revenue per visit, and +3% average order value…compared to those who do not interact with reviews.”
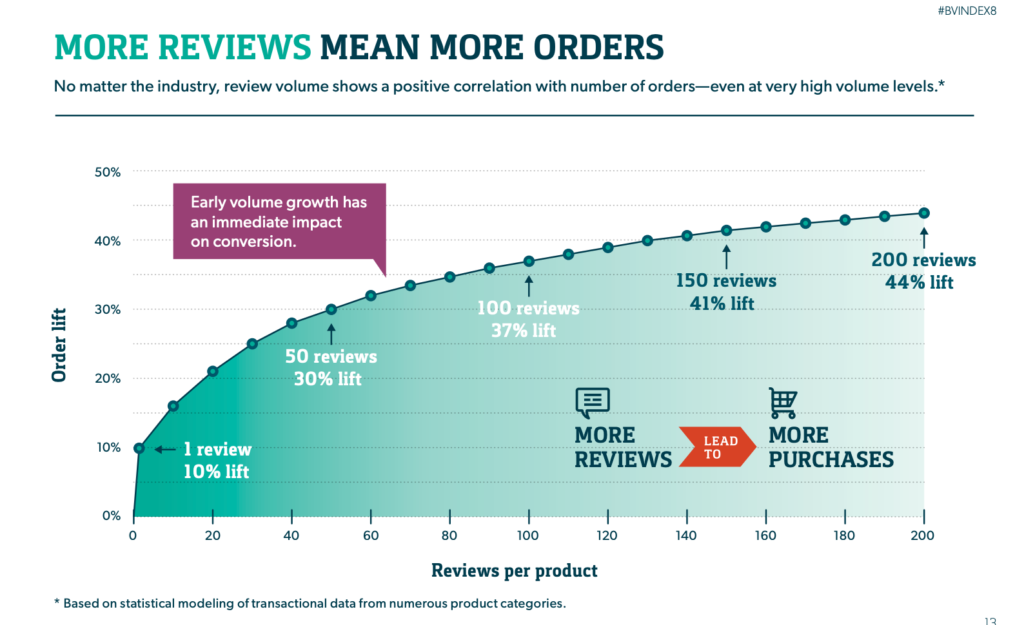
They also found that more reviews mean more orders (in the eCommerce world). In the image below, you can see that the law of diminishing returns applies to reviews. Your first ten reviews may provide something like a 10% lift, but adding ten more reviews when you already have 100 reviews may only add a one percent lift.
In B2B, Gartner Digital Markets has shared similar findings on the significant lift from your first reviews. They found products with 10 or more reviews get 3x the traffic (to their profile page) compared to products with zero reviews. G2 has found that a product needs 50 reviews to “see exceptional growth in traffic to your page and leads (and our data shows another large jump at 100 reviews).”
Reviews for Demand Gen – How to measure ROI on lead generation
If you’re in B2B SaaS demand generation, you know that measuring the ROI of many things, let alone reviews, can be a challenge.
However, there are ways you can measure review site impact. Let’s start by walking through review site-sourced leads.
Review site sourced leads.
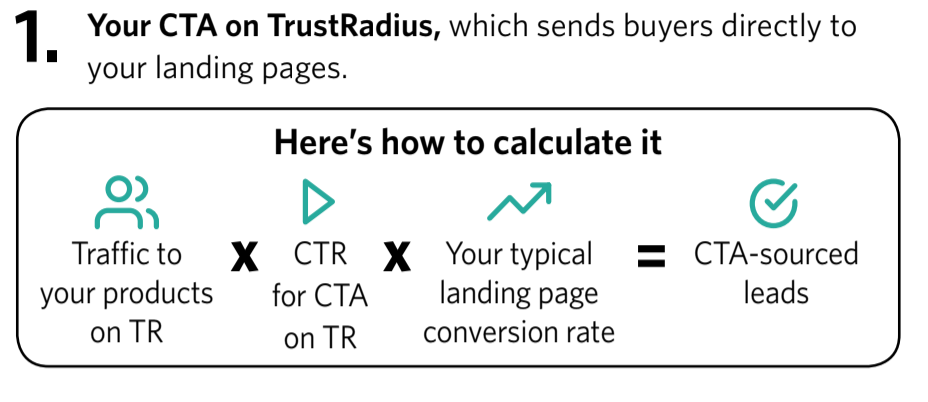
Measuring the impact of this one is relatively straightforward. Like any ad, it’s simply the number of impressions multiplied by the clickthrough rate multiplied by the conversion rate on your landing page. Here’s how to calculate this one with TrustRadius sourced leads:
In a given month, you could calculate the direct lead gen value from any review site like TrustRadius, G2, Capterra, and others like this (note that the example data provided is more reflective of a site like Capterra that tends to cater to lead generation in this way):
- 1,000 monthly visits to your review site profile page and to the category or categories in which your product is listed
- X 10% clickthrough on your call-to-action (e.g. “learn more” (leads to a landing page) (100 clicks)
- X 5% conversion to a lead on your landing page (e.g., start a trial, book a demo, etc.)
- = 5 leads per month (e.g. demo requests or trial starts)
How to measure review site leads in Google Analytics.
While you can measure this process in many ways and systems, most of us have and use Google Analytics, so here’s how you can measure review site lead generation performance by creating conversion goals in Google Analytics.
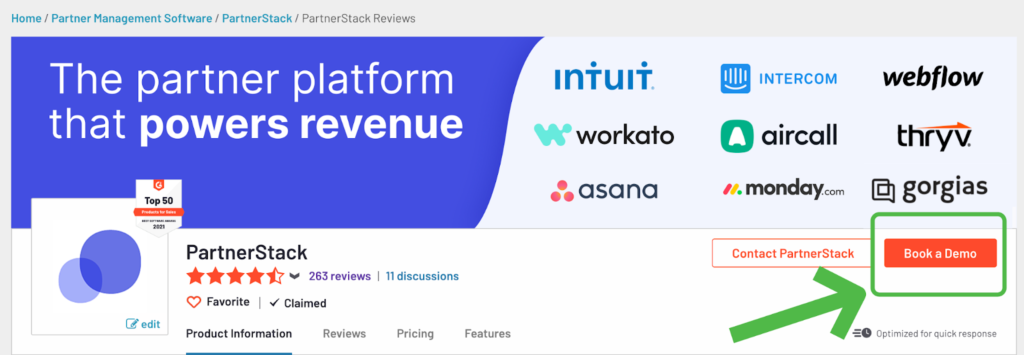
As you can see in this PartnerStack example, our G2 profile page has two Call-To-Actions (CTA) buttons:
- Contact PartnerStack
- Book A Demo
A lightbox popup appears with a form when a visitor clicks on the “Contact PartnerStack” CTA button. These contact forms are G2 forms and can be edited in the my.g2 admin portal. You can select standard fields and add custom fields. For example, at PartnerStack, we added, “What would you like to learn about on this call?” a field that we have on our website contact request form that helps the requester provide more context and specifics on their contact request.
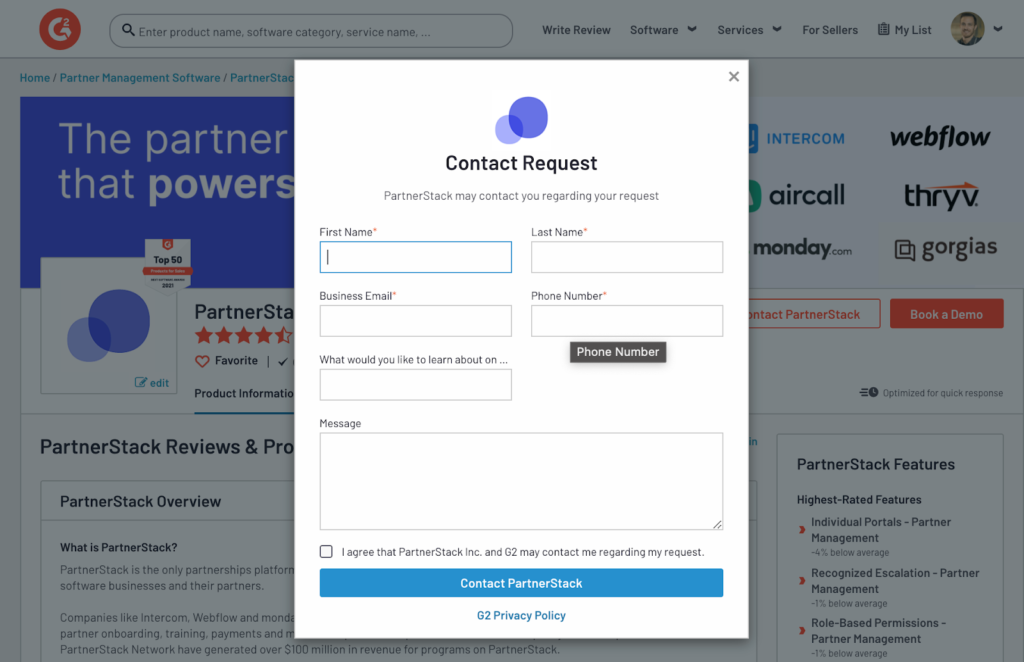
These contact request leads can be delivered to your team in two ways: via email and via an automated webhook into your CRM or marketing automation platform.
The “Contact [Vendor Name]” CTA is the standard CTA option for G2 listings.
Vendors that have a paid subscription with G2 can leverage an additional custom CTA button. In the PartnerStack example, we use “Book a Demo” to send the visitor to our main demo request page, which automatically adds the lead into our system and gets routed to the right person on our end to respond to the request.
To measure the performance of the Custom CTA button, if you’re sending them to a page with a form or some other element that can record conversions, you can set up a conversion goal in Google Analytics and traffic performance there.
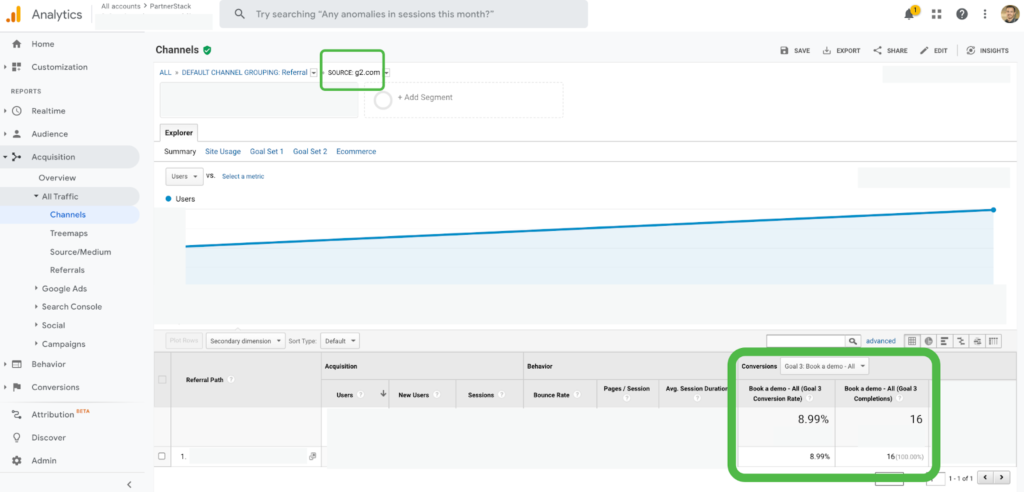
For example, you can see in Google Analytics that we have set up a conversion goal, “book a demo.” To see how many demo bookings we have converted from a traffic source and at what conversion rate, we can go to Acquisition > All Traffic > Channels > Referrals (or All Traffic > Referrals). In this period, we have had 16 demo requests and a visit-to-demo request conversion rate of 8.99% (time period intentionally blurred).
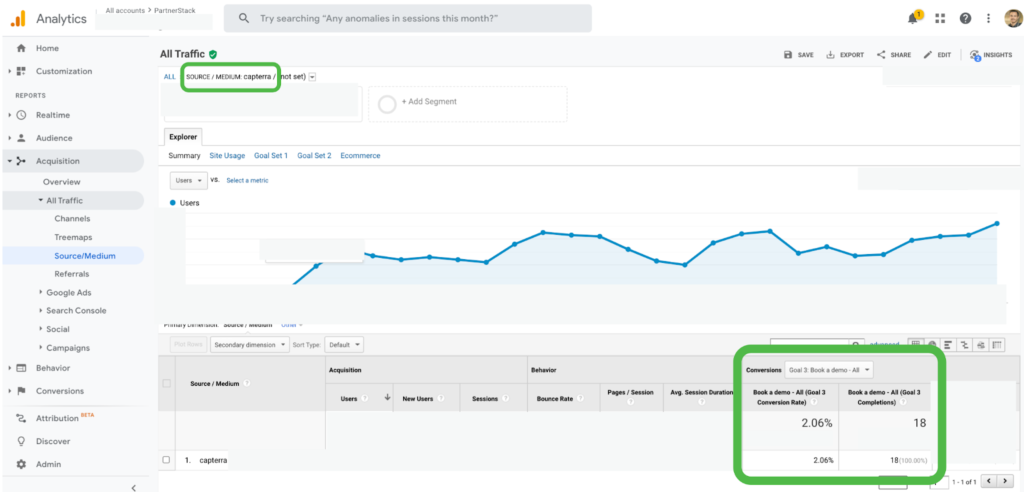
Using conversion goals in Google Analytics to measure B2B software review site performance isn’t limited to G2. As you can see here, we’re measuring the same conversion goals with Capterra, which we see in Source/Medium.
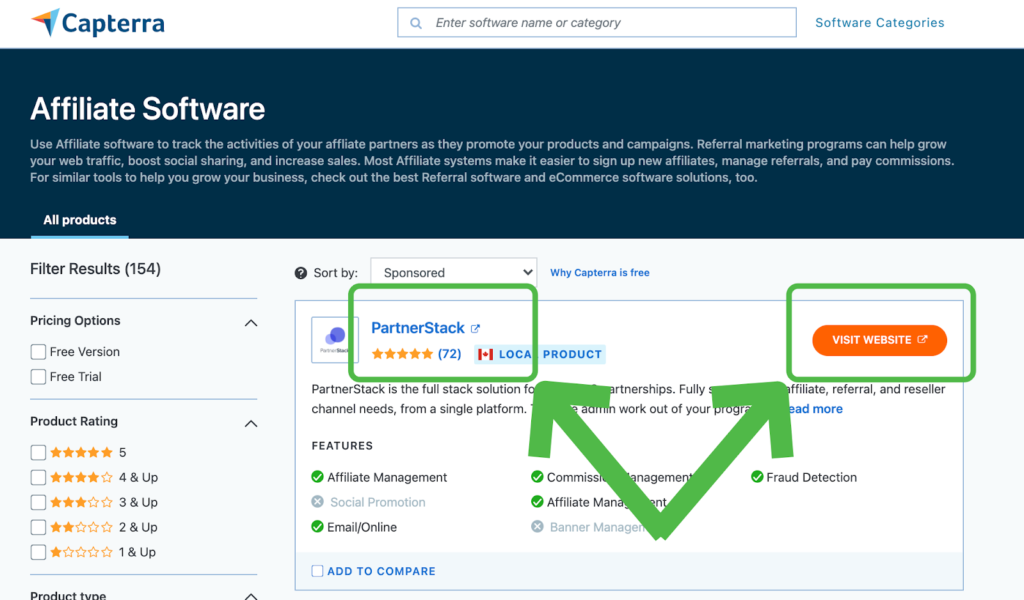
On Capterra (and the other Gartner Digital Markets sites, GetApp and Software Advice), if you leverage their lead generation offering to sponsor your listing(s), your profile links switch from internal links to your profile page on Capterra to your preferred webpage (website or landing page). As you can see in the image of PartnerStack’s profile in Capterra’s Affiliate Software category, both the name PartnerStack and the orange call-to-action “visit website” lead to a landing page tailored to buyer’s of affiliate software.
If you’re anything like me, you probably doubt whether you set up the goal correctly in Google Analytics and wonder, “did we really get X number of demo requests?”.
To check, I recommend cross-referencing with a list or report in your CRM or Marketing Automation platform. For me, I simply made a list in HubSpot, which we use as our Marketing Automation platform, and filtered by “sub source = G2”, which is how we’ve configured our tracking to know which leads come from which sources.
In this case, the number of “book a demo” conversions in Google Analytics matches the number of leads on the filtered HubSpot list (roughly matches; there were a couple more in HubSpot, but close enough for me at this time).
To learn how to create conversion goals in Google Analytics, please visit the Google Analytics Help Page – Create and manage goals.
Beyond direct response leads
It seems simple, right?
The problem is that the direct leads alone from review sites are only one small part of reviews’ value. If you only measure this part of reviews, you’ll significantly undervalue reviews.
To broaden the scope of the demand gen value of reviews to a vendor, think of when buyers may turn to reviews in their buying process. When you do, you realize that buyers turn to reviews more than just at the point of acting on their purchase consideration intent (i.e. when they become a lead).
G2 had an ROI calculator for vendors at one time that helped measure the impact of reviews based on when the buyer engaged with the review in their buying process: before engaging with Sales (pre-opp), early in the opp (weighing their options), and late in the opp (confirming their decision).
In their G2 buyer intent playbook, they now “encourage you to work with your rev ops team to build a report that shows closed-won revenue influenced by at least one G2 touchpoint”. G2 provides no fewer than 18 reporting metrics from which to choose.
In my opinion, the main two metrics (beyond leads sourced directly from review sites) are:
- Potential revenue (i.e. pipeline value) of open opportunities with at least one G2 touchpoint
- % of closed-won deals with at least one G2 touchpoint
Here is how you can measure them.
Four ways to calculate the ROI of buyer intent behaviour on review sites
Self-reported method – how to measure the ROI of buyer intent on B2B review sites
If you’re in B2B SaaS Demand Gen, you’ve probably heard of Chris Walker and his State of Demand Gen podcast and Refine Labs agency.
On his podcast, Chris discusses the disconnect between how B2B SaaS buyers are buying today and the attribution technology and methods that B2B SaaS Demand Gen teams use to measure performance.
In short, he argues that in the past several years, buyers have been educated in communities, peer groups, and podcasts and that the attribution technology and processes haven’t kept up, i.e. they don’t capture any of these critical steps on the buyer journey.
He’s not alone in making this argument. Leading analyst firm Forrester, marketing expert Rand Fishkin, and based on the number of likes on social media posts on this topics, many are feeling the same way: attribution is a mess.
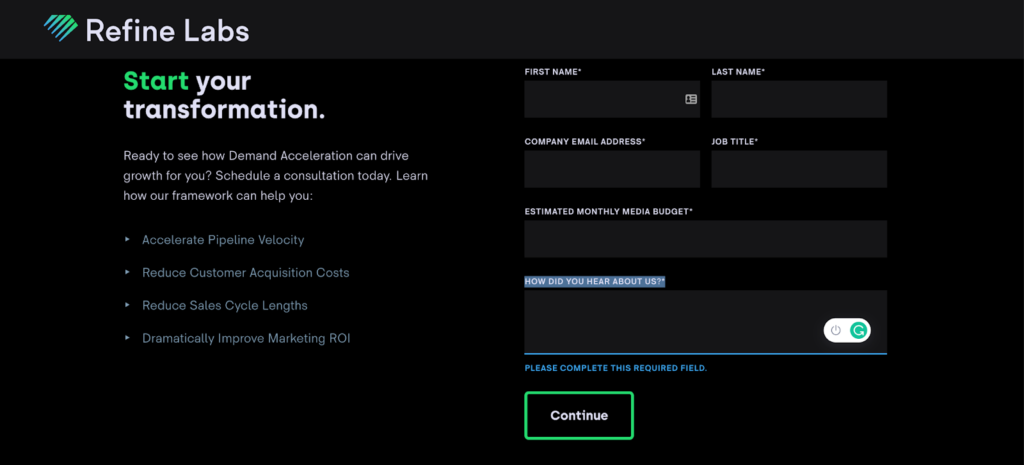
Refine Lab’s solution, as I understand it, is simple. Add a free text field – “how did you hear about us?*” – to your demo / contact us form to learn how to attribute the moments that mattered to the prospect manually.
For example, in Episode 248, The Attribution Mirage Greatest Hits, Chris Walker of Refine Labs shared 20 real-life examples of comparing software attribution sources vs. self-reported attribution sources. The net result? Self-attribution shed light on what the buyer did that led them to the vendor, while the software attribution sources did not.
For measuring the ROI of buyer on B2B review sites, one option is to use this self-reported attribution. You simply add this field to your form – how did you hear about us?* – and see if and how frequently review sites like G2 come up.
We did this at PartnerStack. For two weeks, we tested adding “How did you hear about us?*” on our demo contact us form. Of the 200 or form fills that came through, 63 became opportunities, and seven have since become new customers.
Our problem with this approach was that our leads gave us very little detail in their responses to the question, “How did you hear about us?
The vast majority of responses were along the lines of “google” or “internet,” not the mini-story you would hope for to fill in the attribution blanks.
Only 5 of the leads mentioned review sites. One of these leads became a new customer (of the seven new customers that came in this way during the form test). The other new customers said they heard about PartnerStack from “Online research,” “friend,” “Internet,” and two “referrals”.
But digging into the data a little deeper shows that the new customer who said they heard about us from “online research” came from G2 (referred by G2.com, as attributed in our HubSpot Marketing Hub.) So 2 of the 7, or 29%, of new inbound customers came from review sites (G2).
Digging further into our G2 buyer intent data in HubSpot, we saw that 25 of the 200 leads (12.5%) were associated with an account that showed buyer intent on G2. Ultimately, only 2.5% of our demo request leads mentioned that they heard of us through reviews, but 25% of the opportunities that came through this form during this test period had buyer intent attributed to their account. In other words, this approach underreported the frequency of reviews in our inbound pipeline generation efforts by a factor of 10.
However, other marketers, such as Manuel Rietzsch, have seen higher rates of self-reported attribution to review sites:
If you try this method, think of ways to get your audience to give sufficient detail in their response. For example, consider a character minimum in the free text response field that prompts the lead to elaborate if they write fewer than 20 characters (like “Google” or “Online”).
While this method is easy to implement and provides a way for your prospects to tell you how they found you, I would recommend layering on one of the following approaches to get more insight into how your buyers use review sites.
Manual method: how to measure the ROI of buyer intent on B2B review sites (requires buyer intent subscription)
Note: if you don’t have a buyer intent subscription, but are thinking of getting one, consider asking the B2B software review vendor if they would be willing to provide you with their intent data on your mini account list for analysis. Running a match analysis and providing some sample data seems to be something they will accommodate.
Also, note that while this method may be manual and time-consuming, the benefit of doing it this way is it forces you to dive deep on an opportunity-by-opportunity basis to see how your buyers are or are not using review sites in their buying process. If you’re looking for a quicker method, see the report method.
Here are the five steps of this manual method:
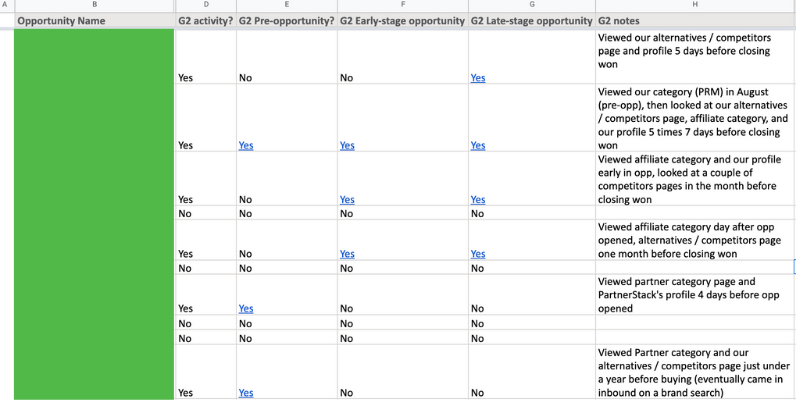
Step 1: Download a list of recently closed-won opportunities from your CRM. You can decide how many accounts you want to go through; I went through 50 accounts for this exercise.
Step 2: Add five columns to the list:
- A new or existing customer?
- For this exercise, I only selected new customers, but if you want to get a sense of how retention, upsells, etc., are impacted by current customers using review sites like G2, add some recent renewals, churns, upsells, etc.
- G2 buyer intent activity?
- Is there any relevant recorded buyer intent activity on G2 from the account? Buyer intent behaviours include things like category views (e.g. Affiliate Marketing software), profile views (e.g. PartnerStack), comparison views (e.g. PartnerStack vs. Impact), and more.
- G2 Pre-opportunity?
- Was their G2 activity on the account before opp creation? You can decide how far back you want to go (e.g. 90 days before opp creation).
- G2 Early-stage opportunity?
- You could slice this a couple of ways:
- The buyer intent behaviour could define Early-stage. For example, a G2 category view is a visitor on the G2 Partner Management software category.
- Alternatively, early-stage could be defined by the date of the opportunity creation and the date of the buyer intent behaviour. For example, one of your recently open ops visits one of your G2 category pages. I used this as the working definition I used for this exercise.
- You could slice this a couple of ways:
- G2 Late-stage opportunity?
- Again, you can slice it two ways:
- The buyer intent behaviour could define late-stage—for example, G2 comparisons of you vs competitors.
- Or it could be defined by the date of the opportunity close date and the date of the buyer intent behaviour. For example, one of your buyers looked at your alternatives/competitors page just a few days before they decided to buy your software. I used this as the working definition I used for this exercise.
- Again, you can slice it two ways:
Your sheet will look like this (the green box intentionally blocks the opportunities. “G2 notes” provide some context on the yes/no response data.)
Step 3: Search in my.g2 buyer intent for the name of an account with a won opportunity.
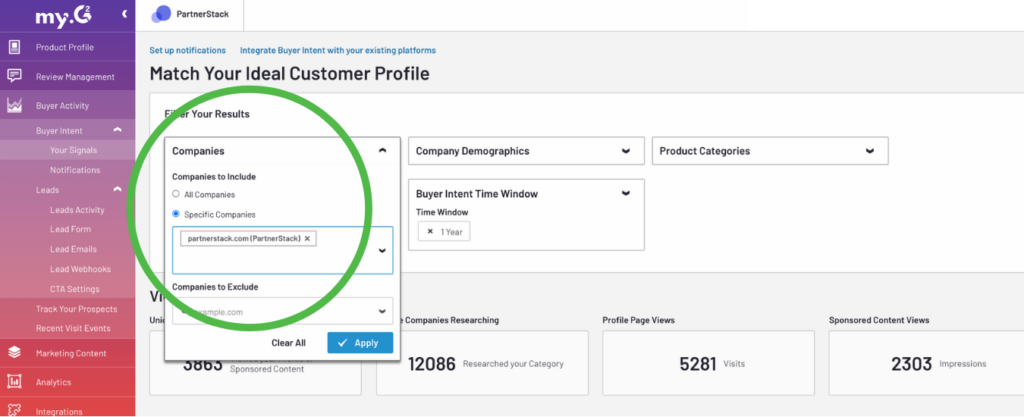
Step 4: Mark if there was any intent (yes/no)
After you apply the specific company’s name and your buyer intent time window, you will see whether there is any recorded buyer intent activity for that account. If no, mark it as none and move on. If yes, drill into the details to see when the buyer intent activity occurred.
Step 5: If there is intent activity, mark which types (pre, early, late-stage opportunity)
I analyzed 50 of the most recent new customers of PartnerStack. Here’s what I found:
- 58% of Mid-Market buyers had G2 buyer intent activity
- 28% of all buyers had G2 buyer intent activity
- 20% of all buyers had G2 buyer intent activity pre-opportunity creation
- 12% of all buyers had G2 buyer intent activity early-stage opportunity
- 12% of all buyers had G2 buyer intent activity late-stage opportunity
- 6% of all buyers were marked as sourced by G2, i.e. our first attributed touchpoint with the contact who bought from us was referred to our site by G2
These numbers will vary by company. I’ve seen the G2 buyer intent activity as high as 40% in my previous roles for closed-won deals (with a higher proportion of mid-market and enterprise buyers).
The G2 buyer intent activity pre-opportunity creation helps us understand how much G2 is contributing to pipeline creation. When we look at first touch attribution, G2 only contributed 6% of the new pipeline. Still, by layering on G2 buyer intent activity pre-opportunity creation, one could argue that G2 is helping create 20% of the new pipeline for PartnerStack because, in simpler terms, 1 in 5 buyers look at G2 before engaging the vendor (PartnerStack in this example).
The G2 buyer intent activity for early-stage and late-stage opportunities gives a sense of how G2 is helping influence deals. This data allows us to see how much our buyers turn to G2 after engaging them.
If this seems too time-intensive for you, consider the report method.

Report method: how to measure the ROI of buyer intent on B2B review sites
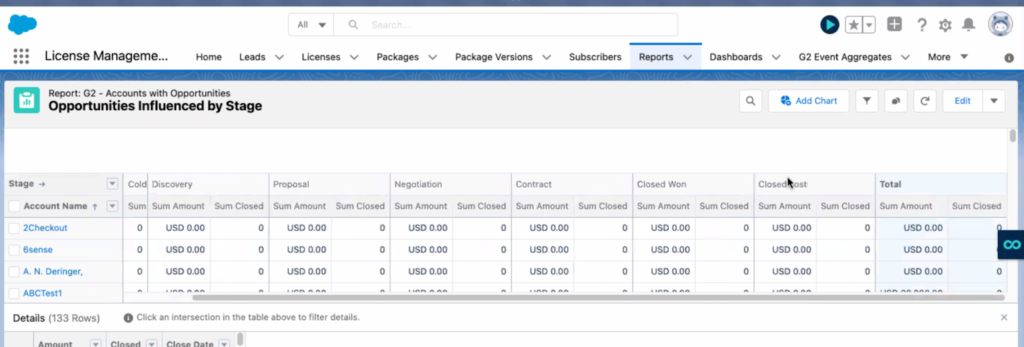
If the manual method seems too time-consuming, have no fear. With G2, they have an out-of-the-box Salesforce report that can help. It’s called “G2 – Accounts with Opportunities: Opportunities Influenced by Stage”.
This reporting method is easier than the manual method, depending on your ability to edit reports or access someone who can for you.
The report is set up to count both the number of opportunities and their value by which stage they are in your pipeline. Here is what the report and the stages in it look like out-of-the-box.
Ensure that the report uses the cross filter, “Accounts with G2 Visiting Organizations”.
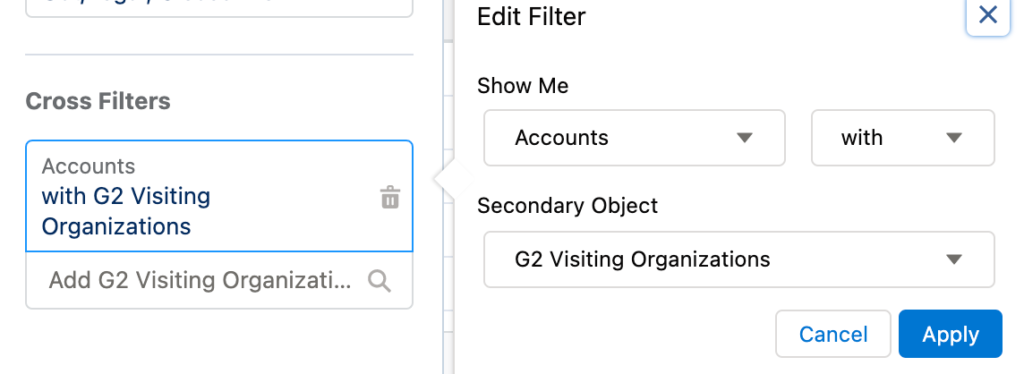
Note that this report out-of-the-box shows how many accounts with opportunities have a recorded G2 buyer intent visit, the dollar value of those opportunities, and where each opportunity is in the process. Therefore, it’s better suited to provide a snapshot of how reviews are impacting your current pipeline than a historical summary.
For example, to get a sense of the impact that G2 buyer intent visits pre-opportunity creation, you would need to work some Salesforce magic.
Salesforce magicians might be able to make custom reports to measure:
- All influence – G2 visit happened 90 days before opp through to closed-won date (this would filter out the g2 events that occur well before an opp and after the opp)
- Pre-opp influence – G2 visit occurred within six months of opp creation
- Open opp influence – G2 visit occurred while opp was open
- Customer influence – G2 visit occurred at a customer account while there was a customer
Nevertheless, the out-of-the-box report still gives you a basic attribution between G2 buyer intent visits and your revenue.
Attribution Tool Method: how to measure the ROI of buyer intent on B2B review sites
If you’re looking for a best practice example of G2 ROI measurement, look no further than CloudCherry (now Cisco Webex Experience Management).
Back in 2019, then Head of Global Marketing at CloudCherry, James Gilbert, shared an impressive approach to measure review site performance in an ROI Masterclass. While his approach is impressive, it’s not easy for us all to pull off a masterclass in ROI reporting.
This approach requires attribution tooling, such as Bizible. If you have the tooling or would be willing and able to get it, this approach will help you with a best practice method to measure G2 ROI (and how to use buyer intent more broadly).
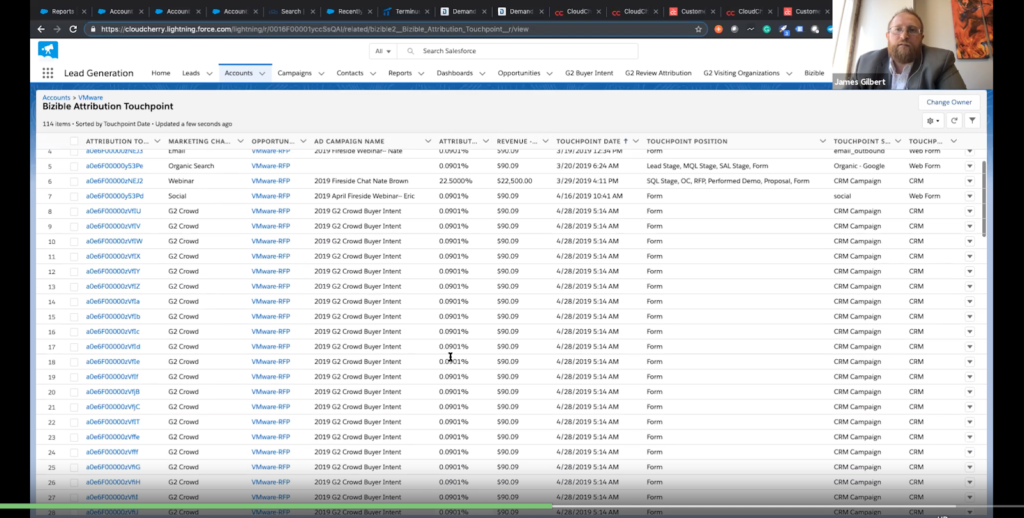
This approach is more advanced because it moves beyond a first touch or last touch attribution model to a multi-touch attribution model. Every touchpoint is attributed (with a % and $ value) in it. In one example, 22-minutes into the webinar, a buyer (account) had events as their first and last touchpoints but lots of G2 activity in between. By attributing touchpoints throughout the buyer’s journey, they could measure the true value of a review site like G2.
When looking at all-time touchpoints by channel, CloudCherry found that G2 had the most touchpoints of any channel.
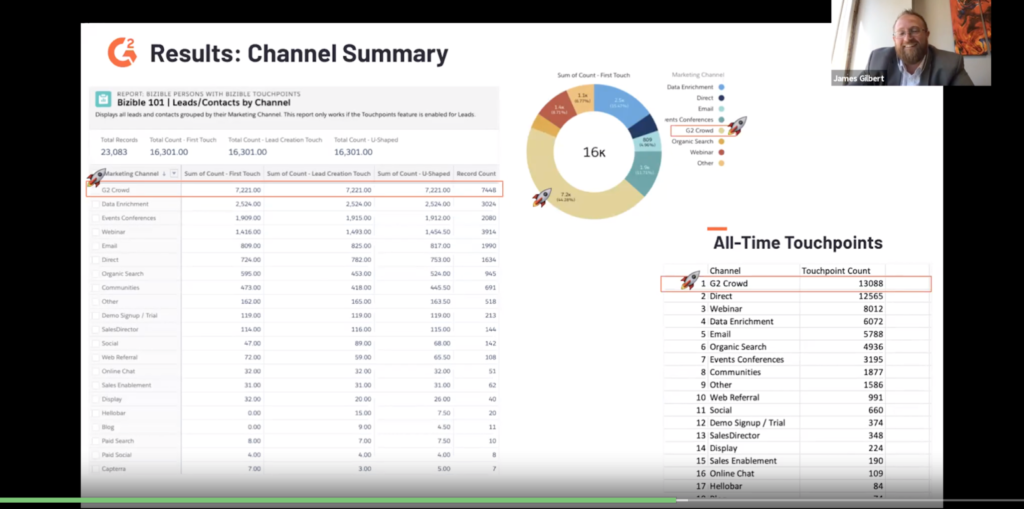
The results for CloudCherry were remarkable:
- 76% of their late-stage deals had at least 2 G2 touchpoints (like visiting a profile, running a comparative view, engaging a landing page featuring G2 data or report content)
- They 3Xed their pipeline in the 12 months after using G2’s Buyer Intent Signals (compared to the previous 12 months period).
- All of this led to G2 being their single most influential touchpoint in their 44-layered marketing mix.
So there you have it, three ways to measure the impact of reviews from buyer intent.
If you want to broaden the scope of reviews attribution, you can consider attributing all Marketing that includes review content. For example, Cision has taken this approach and attributes 35% of its new business pipeline to Marketing with reviews, as presented in a webinar by TrustRadius.

Example of Measuring the Impact of Online Reviews in B2B SaaS: The Impact of G2 Reviews on PartnerStack
G2 has had a major impact on the growth of PartnerStack.
PartnerStack has generated over $6.5 million in SaaS subscription revenue from accounts with some form of G2 buyer intent (i.e. one or more people at companies that have bought PartnerStack visited PartnerStack’s G2 profile or one of the categories in which G2 lists PartnerStack).
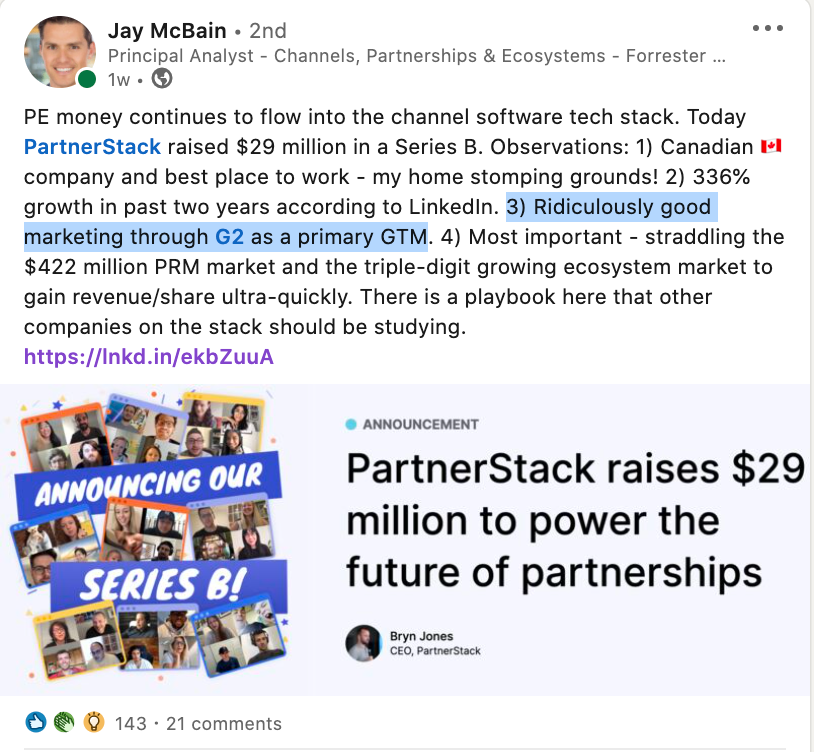
There has been third-party recognition from Jay McBain of Forrester, arguably the leading analyst for tech partnerships, on how important G2 has been for PartnerStack’s go-to-market.
Here’s a summary of PartnerStack’s performance on G2:
- +$6.5 million in SaaS subscription revenue from accounts that have had some form of G2 buyer intent
- +$5 million in open pipeline from accounts that have had some form of G2 buyer intent
- 28% of recent PartnerStack buyers (i.e. the most recent 50 new customer accounts for PartnerStack) have had G2 buyer intent activity either shortly before connecting with PartnerStack (pre-opportunity creation) or during their buying cycle (post-opportunity creation, pre-opportunity closed won), with 20% of these opportunities having buyer intent on G2 shortly before opportunity creation. 58% of recent Mid-Market buyers had G2 buyer intent activity
- 153% increase in visits (23,010) to PartnerStack’s G2 profile in the past year and growing at more than double the rate of category visits to Partner Management (up 72% to 121,495 Visits to Partner Management)
- 147% increase in total active buyers for PartnerStack on G2 (3,893) in the past year, and growing at roughly 50% more than the rate of total active buyers for Partner Management (up 98% to 8,179 Total active buyers for Partner Management)
- Similar growth rates in total active buyers for PartnerStack in the other two categories that it’s in: Affiliate Marketing and Partner Ecosystem Manager
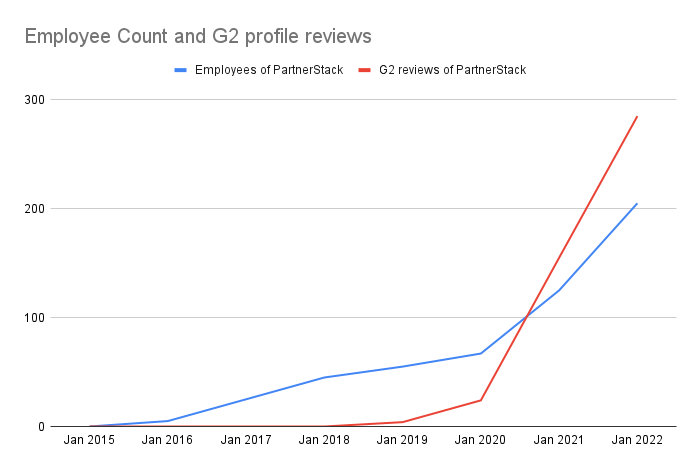
When you look at the growth of PartnerStack as a company, you can see the impact that G2 reviews have had on it.
While there are many reasons why there was a PartnerStack employee growth inflection point around April 2020, there is a positive correlation, and likely some degree of causation, from G2 reviews.
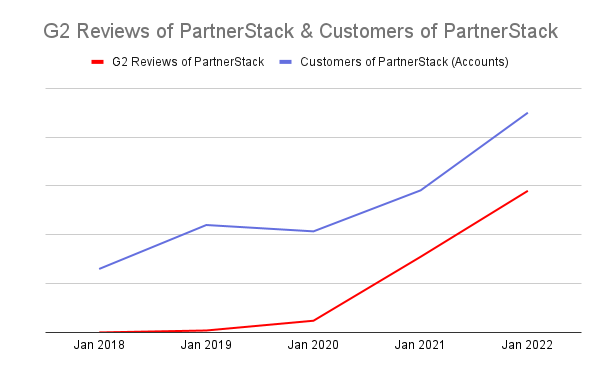
The inflection point on the number of PartnerStack customers has an even stronger positive correlation with reviews on G2.
The importance of G2 for PartnerStack will rise with the continual growth in the number of buyers that visit the Partner Management, Affiliate Marketing, and Partner Ecosystem software categories on G2.
Author
-

I'm the Founder and Editor-In-Chief of B2B SaaS Reviews and the Director of Demand Generation at PartnerStack, the leading platform for partner management and affiliate marketing in B2B SaaS. My experience spans several notable B2B SaaS companies, including Influitive (Advocate Marketing), LevelJump (Sales Enablement, acquired by Salesforce), and Eloqua (Marketing Automation, acquired by Oracle). I hold a Bachelor of Commerce in Marketing Management from Toronto Metropolitan University and a Master of International Business from Queen's University, with academic exchanges at Copenhagen Business School and Bocconi University.

